The Portland CEI Hub Doesn’t Last Forever
Proceedings Before the Oregon Department of Environmental Quality
To Fuel Tank Seismic Instability Team and Members of the Environmental Quality Commission:
Submitted to: SeismicStability.2023@DEQ.oregon.gov
Summary
With a routine rule change the US EPA can bring the Portland fossil fuel tanks into compliance with existing environmental protection, because the threat of corrosion here is multiplied by the threat of flood plain exposure multiplied by the major threat of Cascadia and local geology. The need to accomplish this is urgent when the math defining the geologic risk is double-checked and updated. Lapses from the EPA, fossil fuel infrastructure jeopardy to public safety and environment, and the absence of any Oregon public safety or economic security regulatory authority have forced Multnomah County into frontline leadership.
Oregon DEQ, Columbia Riverkeeper and coalition members in their July 11 submittal to DEQ clearly understand the consequence part of the risk equation.
https://docs.google.com/document/d/1axSKViDaK49Y4Q4nA4B4yDL4rke2DwiGNbsbM7CWyBg/edit
So too the media. https://www.oregonlive.com/pacific-northwestnews/2018/03/when_the_big_one_hits_portland.html
Risk management methodology always includes factoring consequences and likelihood. We need more than precise legal assessment. Natural law needs attention also. Better Energy LLC offers STEM research results pointing to currently unrecognized probability computations calling for immediate policy change.
Bridge City Looks to the Future
Now and then we close a bridge across the Willamette for maintenance. We have never seen all of them down. Why bring this up? Engineers report that due to lack of seismic specifications most of our bridges will be usable. https://www.kgw.com/article/news/investigations/theportland-bridges-that-will-collapse-in-an-earthquake/283-291062061
The discovery of truly catastrophic Cascadia earthquakes is only recent, after the problem bridges were already up. First bridge planned for a rebuild is the Burnside, in 10 years, maybe 20. Sooner if the Cascadia event happens first.
If there has been no catastrophic seismic event since 1700, should we be worried?
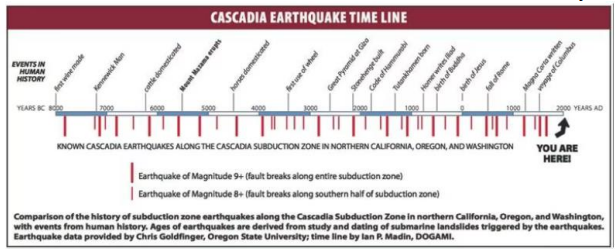
First thing to notice is that long intervals between M8+ or M9+ seismic events are evident in the first 4,000 years. Then, in the most recent 6,000 years, the event intervals have been getting shorter. No need to know why. The historic data says, “it is what it is.”
Looking Back in Time
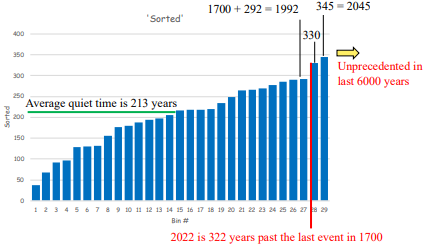
The result is that by 1993, 93% of quiet times in the last 6000 years are behind us. Seems we are overdue. The 6,000-year dataset of 29 intervals is found here. This is all we know about.
https://better-energy-llc.com/wp-content/uploads/2023/03/10k-vs-6k.pdf
This kind of analysis looks only at what we know, without attempting prediction.
Predictive Math
Seismic policy experts in Oregon and Washington subscribe to different math. In the interest of making predictions, statistical model assumptions are made. They conclude that there is a futuristic probability of around 35% in the next 50 years for such an event, nothing like saying 93% of known intervals are behind us. This advice comes from scientists who rely on math that assumes probability distributions found in nature where these distributions appear from the study of:
- Measures of size of living tissue (length, skin area, weight).
- Certain physiological measurements, such as blood pressure of adult humans
- Extreme values of such variables as monthly and annual maximum values of daily rainfall and river discharge volumes
- In reliability analysis, the log-normal distribution is often used to model times to repair a maintainable system.
So statistical distributions can be discovered in raw data observations, or they can be assumed as a tool to coax conclusions from a raw dataset, employing trial-and-error modeling methodologies. Oregon and Washington make assumptions as follows.
How Geologists Employ Distributions
The 10,000-year timeline is the product of years of research as reported in “2012 Paleoseismicity of the Cascadia Subduction Zone.” https://pubs.usgs.gov/pp/pp1661f/pp1661f.pdf
Here we find 13 authors citing 21 different 50-year probabilities computed from at least 17 different predictive distributions. Seismic policy decision-makers have been heavily influenced by this probability distribution math that only looks at 50-year estimated math.
Since this report was issued, it has been reported that the basin terrain that we find in Portland will resonate and amplify liquefaction and surface shear effects.
https://ui.adsabs.harvard.edu/abs/2020EGUGA..2221355S/abstract
Probability Distributions
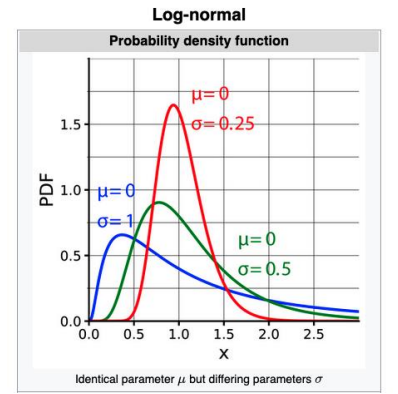
If geologic processes conform to the other natural processes observed by best science, we can interpret our 29 data points to be arranged in a log-normal distribution typically employed for observations taken from datasets of positive numbers.
Mu = an average of the values of log-transformed data
Sigma = scatter of log-transformed data (std dev)
The scientific precedent for invoking the log-normal distribution has been referenced by USGS Circular 1053.
https://authors.library.caltech.edu/50427/1/Allen_1990_USGS_Circular1053.pdf
Appendices in the Allen circular are instructive regarding 30-yr math estimates.
Log-Normal Cascadia Predictions
We employ log-normal distribution to estimate what the probability of a Cascadia event is today and in succeeding decades.
At point “0” the probability of catastrophe in the next year starting today is 1%. For perspective, let’s look at the actuarial numbers for fire insurance covering a property with a $500,000 mortgage. The required fire insurance is about $500 per year. As a risk mitigation percentage this is:
500/500,000 = 1/1000 = 0.1%
This means our Cascadia log-normal distribution reveals a risk of occurrence of 10x that of a standard fire casualty claim.
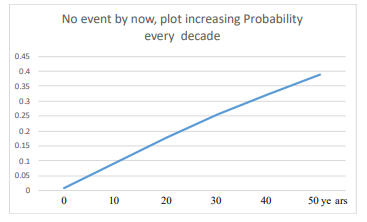
At year 10, the probability of a catastrophe is 9%, and at 20 years from today it is 18%. At 50 years from today we see 39%. To rely only on this form of probability plot is to incorrectly conclude there is a leisurely 50-year planning period available to assure public safety.
In our application of log-normal distribution to the 29 most recent Cascadia intervals, we depict the probability of a Cascadia event as the years go by, when no event occurs.
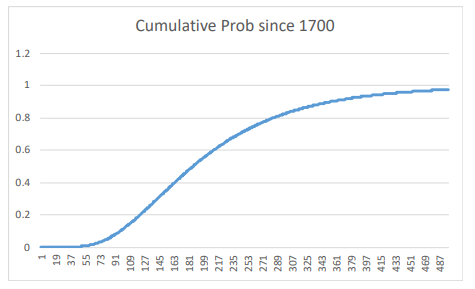
In year 320, i.e. 2020, the probability that this event will have occurred by now is 86% and increases every year in the future. This is of course consistent with the accumulation of tectonic stress.
After this closer look at conventional math, even after making conventional assumptions about the mathematical behavior of unknown complex geologic processes, the accumulated Cascadia risk is 86% and growing rapidly as tectonic stresses build up without relief.
Three Answers To the Same Question – What About Public Safety Risk?
If we define public safety risk as the known threat to public infrastructure and services that a healthy populace and economy depend on, Cascadia geology is a public safety risk.
Analysis of Cascadia event intervals is summarized by the math methods employed, producing diverse risk assessments.
These high percentages call for immediate improvement in seismic investment, which at time of writing only consists of one study (SB 1567), one PDX runway, and one bridge (Burnside). These numbers all tell the same dire story, although one has been received by seismic policy experts who have been falsely reassured from not being accustomed to the meaning of statistical assumptions. As a result, infrastructure resilience funding is perceived by public safety budget allocators as not needed, relying primarily on emergency management expenditure.
Public safety risk is not answered by emergency management (EM), which assumes that management methods can deal with any emergency. Are there risks that, when they occur, exceed any capacity to be managed without huge collateral casualties? With current EM planning, how many casualties are thought to be acceptable? Rita/Katrina experience in New Orleans is instructive.
What Public Assets and Civic Services Are at Severe Risk?
It’s more than bridges and a runway. Hundreds of CEI Hub storage tanks are poised to become unstable during liquefaction and models have shown lateral movement of up to 20 ft toward the river. Collision with other hazardous material tanks will lead to petroleum product releases and fire. Wetlands and estuaries that sequester more carbon than forests will take the brunt of catastrophic pollution along 100 Columbia River miles to at least Astoria.
The CEI Hub capacity is replenished every week. The loss of this capacity will be felt on the day of. In New Palestine OH, the public safety authorities made this statement: “The safest thing to do is blow it up.” With petroleum spills, management authorities chose between damage to shoreline vegetation, wetlands or estuaries, or just burn off the pollutants if not accidently ignited.
Emergency Management authorities in Oregon and Washington will ration available emergency transport fuel. The 4 refineries that feed Portland from a single 60-year-old pipeline from Puget Sound are no more seismically robust than Portland bridges and riverside tank farms. No one knows what emergency fuel supply to plan for.
The demand for urgent investment in robust infrastructure is far beyond question or partisan political drama about the future of the Republic. Every coastal and inland residence, garage, barn, and farmhouse will need a secure fuel supply, which today cannot be assured.
US EPA Rules Currently in Force
Rule Change
Multnomah County Oregon Takes Action
Multnomah County Democrats in correspondence from June 27, 2023 requested that DEQ rules include acknowledgment of tank standards set by the EPA in CEI Hub operator submittals.
https://multdems.org/wp-content/uploads/2023/07/M-Rules4reports-Endorsed.pdf
Multnomah County Commissioners have decided to seek damages from industry regardless of the near-term threat discovered by best science. The Court can award Multnomah County $50B after heat dome conditions caused loss of life and widespread misery. Plaintiff attorneys see the prospect of $10B in court awarded fees. Not everyone is willing to rely merely on protracted and unpredictable litigation. A Court invoking redressability is of course again possible.
Multnomah County Democrats recognize the need for more urgent action. This essay constitutes a demand for the EPA to re-institute its successful hazardous materials tank storage replacement program for above ground tank infrastructure ahead of a predicted catastrophe. The only question remaining is, who should author and issue the undeniable petition to save Oregon from the worst infrastructure collapse in history and its threat to public safety, public health, and economic stability. And that of Washington State.
Respectfully submitted,
Tracy Farwell, Better Energy LLC
Sustainability Desk, Infrastructure Journalism